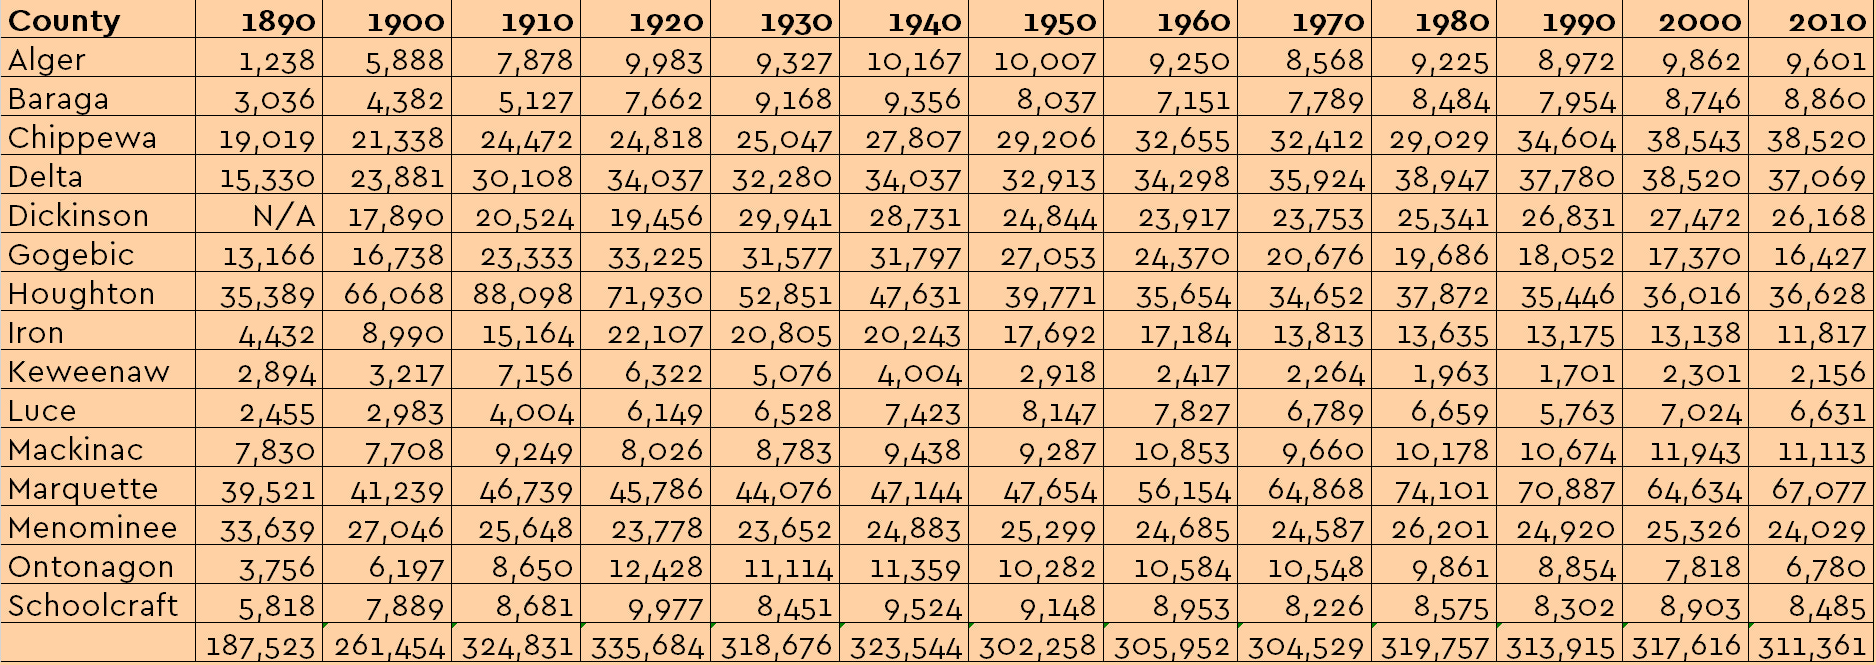
One myth about the Upper Peninsula is that its population is much smaller than during its heyday in the early 20th century. Certainly, there are parts of the U.P. that have seen a drop in population, but the actual population of the U.P. has remained relatively stable since the 1930's. Considering that the second half of the 20th century was marked by a reduction in extraction industries and industrial activities, it might be a surprise that its population has not dropped. In truth, some of those jobs were replaced by the service sector, the growth of universities and colleges across the region and tourism. In the end, it is the love of the U.P. that has kept families here for generations and brings new residents every year.
However, the future is not all rosy with regards to population numbers. Nationally, the percentage of the populace 65 tears of age and older is 13%. In Michigan, it is 13.5%. In the Upper Peninsula, it is 17.6% and in some counties it is as high as 26%. What this shows is that the U.P.'s population is aging faster than other parts of the country and state and that there is not a younger population replacing them as residents. Time will only tell if the U.P.'s population will drop precipitously in the coming decades due to these statistics, or if new migration patterns due to economics, placemaking, and climate change will flip the trend.
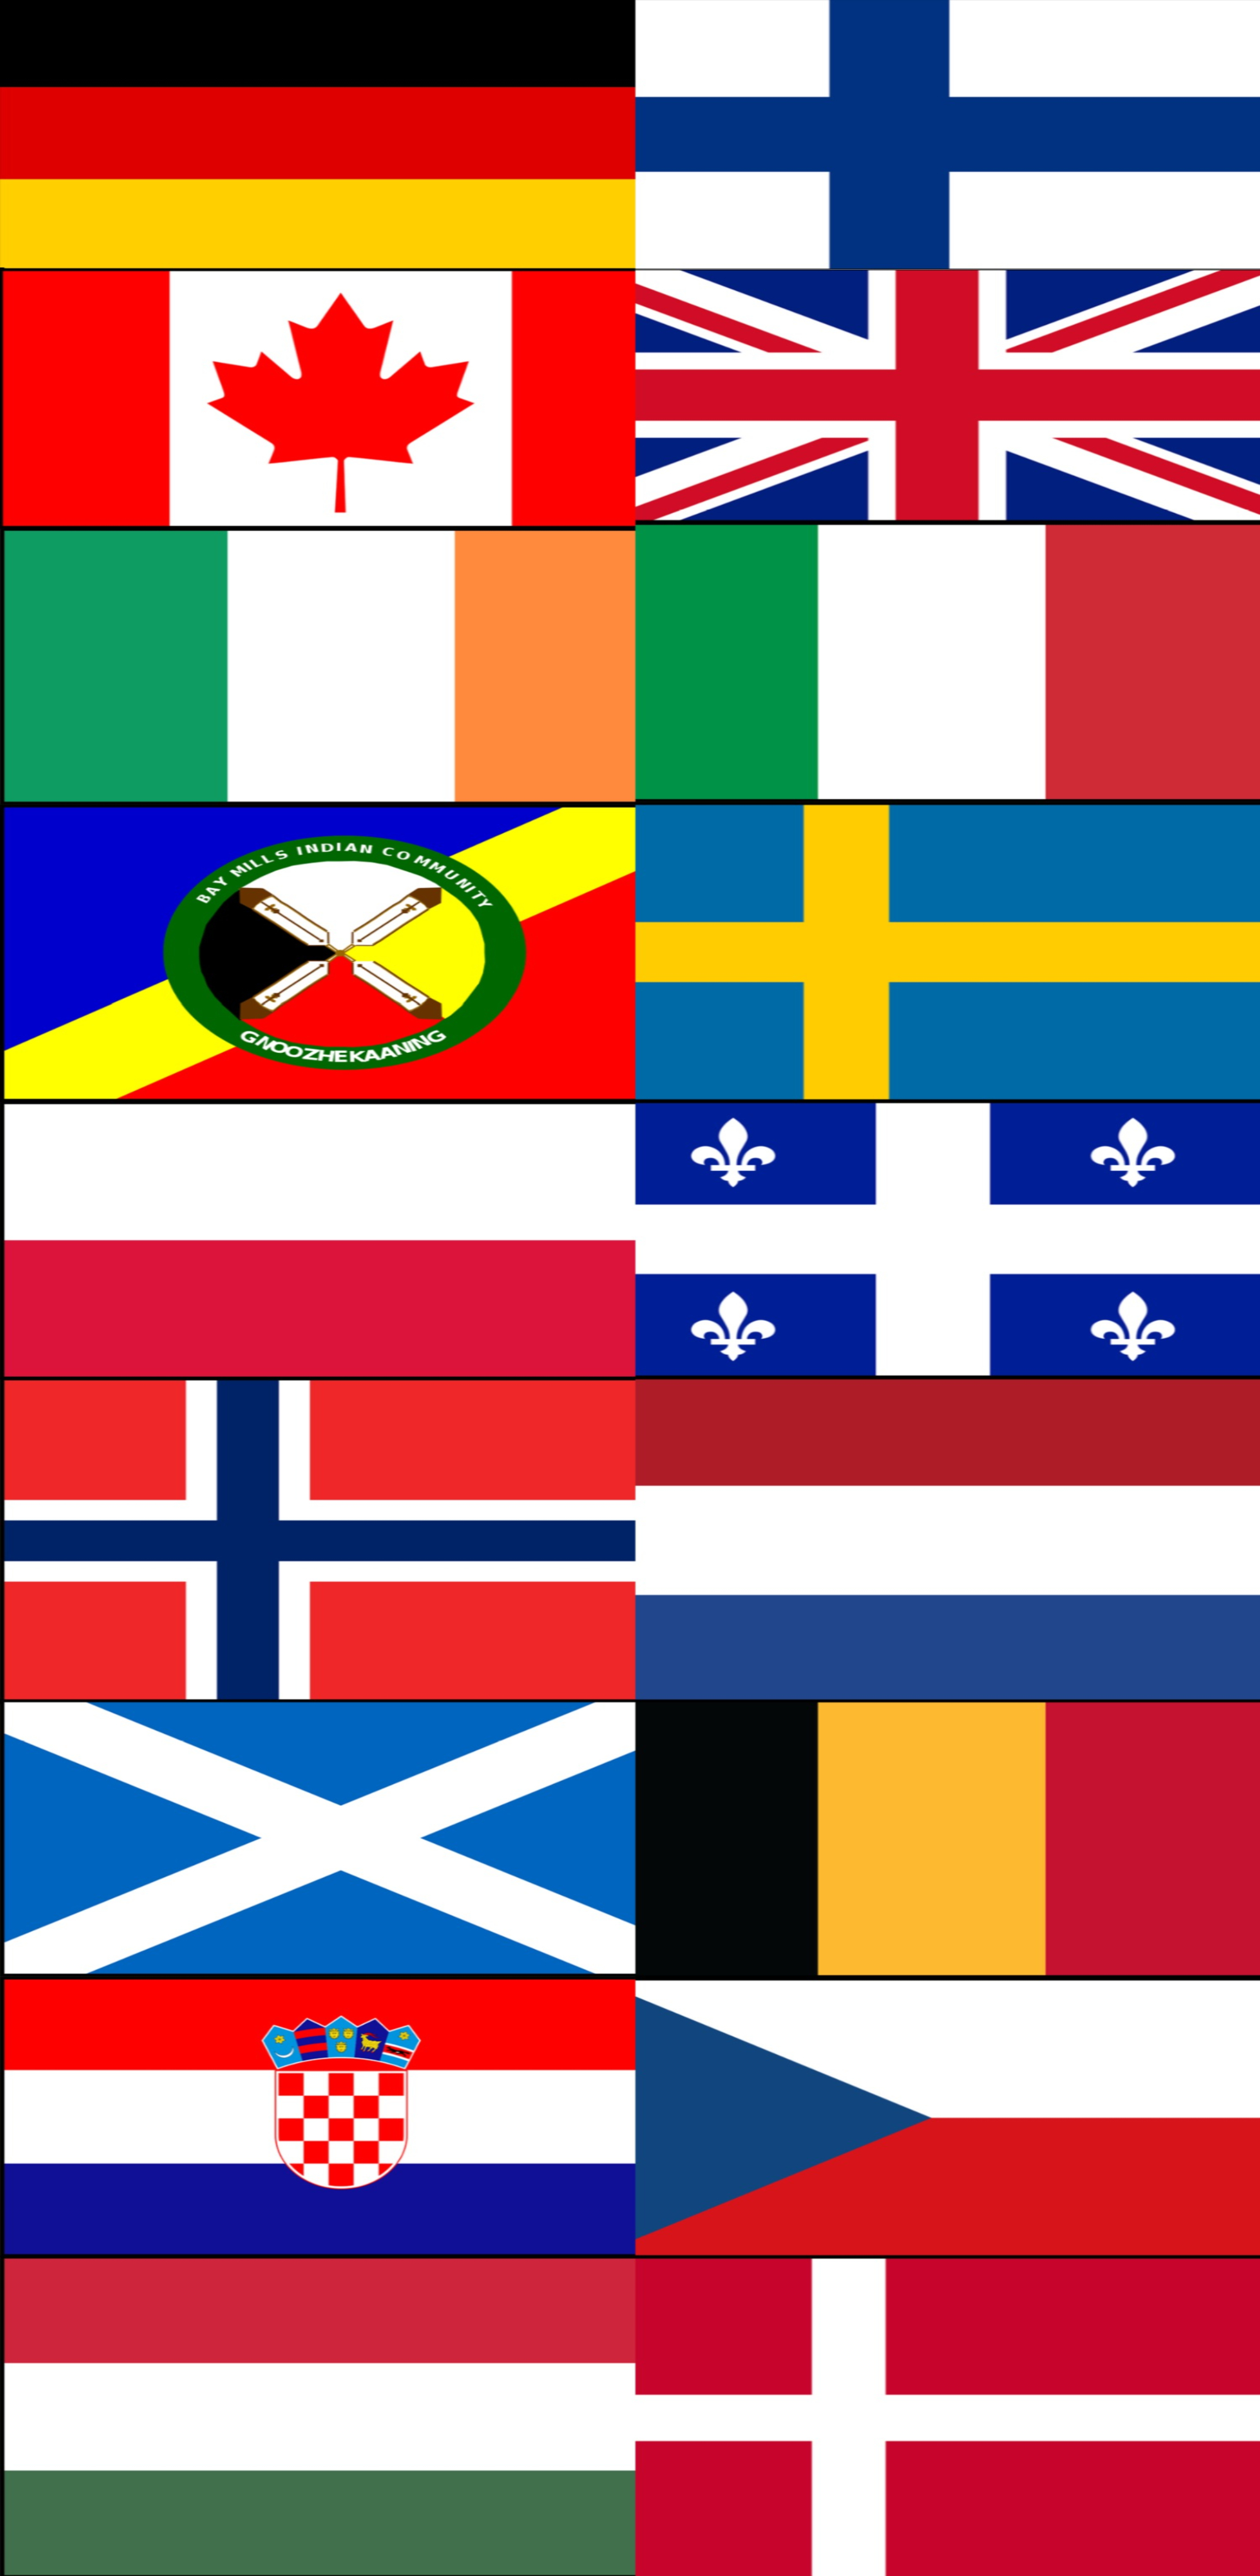
The ethnicity of the U.P. is a different matter. When people fill out their census forms they are asked to voluntarily fill in a First Ancestry and Second Ancestry. Many people do not fill in this box or simply say, "American." However, from the respondents that do answer, we can estimate the relative ethnic/cultural makeup of the U.P.
Where people of Finnish background are still dominant in parts of the U.P., German is now the ethnicity claimed most in the First Ancestry question. This corresponds with the rest of the United States, where German is the most prevalent ethnicity. Finland is a close second. French is third, but in truth, there was never a large emigration of people from France directly to the U.P. The vast majority of the respondents saying French are most likely of French-Canadian column, it makes the number close to 30,000 residents. English is also deceptive, in that it does not differentiate between people from Cornwall or England; However, there are separate categories for Scottish, Scotch-Irish and Welsh.
The statistics below are from the 2010 U.S. Census. They only represent the
individuals who chose to answer the question about their ancestry.
Of the 311,361 UP citizens, 81,395 chose not to answer the question.
| Upper Peninsula Population |
2010 |
311,361.00 |
| German |
40,706 |
13.07% |
| Finnish |
33,727 |
10.83% |
| French (probably Canadian) |
19,658 |
6.31% |
| English |
18,877 |
6.06% |
| Irish |
16,628 |
5.34% |
| Italian |
15,490 |
4.97% |
| American Indian |
14,241 |
4.57% |
| Swedish |
14,190 |
4.56% |
| American |
13,711 |
4.40% |
| Polish |
13,571 |
4.36% |
| French Canadian |
9,050 |
2.91% |
| Norwegian |
4,415 |
1.42% |
| Dutch |
4,216 |
1.35% |
| Scottish |
3,191 |
1.02% |
| European |
2,745 |
0.88% |
| Belgian |
2,178 |
0.70% |
| Croatian |
1,719 |
0.55% |
| Scotch-Irish |
1,578 |
0.51% |
| Arab |
1,177 |
0.38% |
| Czech |
1,160 |
0.37% |
| Scandinavian |
1,078 |
0.35% |
| Hungarian |
1,044 |
0.34% |
| Danish |
870 |
0.28% |
| Russian |
776 |
0.25% |
| Canadian |
715 |
0.23% |
| Austrian |
607 |
0.19% |
| British |
510 |
0.16% |
| Arab: Lebanese |
509 |
0.16% |
| Welsh |
482 |
0.15% |
| Subsaharan African |
894 |
0.29% |
| Greek |
450 |
0.14% |
| Lithuanian |
447 |
0.14% |
| Ukrainian |
386 |
0.12% |
| Czechoslovakian |
371 |
0.12% |
| Swiss |
323 |
0.10% |
| Slovene |
284 |
0.09% |
| Northern European |
278 |
0.09% |
| Romanian |
269 |
0.09% |
| Yugoslavian |
217 |
0.07% |
| Arab: -Arab |
199 |
0.06% |
| Slovak |
192 |
0.06% |
| Arab: -Other Arab |
179 |
0.06% |
| Bulgarian |
173 |
0.06% |
| West Indian |
151 |
0.05% |
| Arab: -Moroccan |
148 |
0.05% |
| Portuguese |
138 |
0.04% |
| Luxemburger |
134 |
0.04% |
| Slavic |
134 |
0.04% |
| Brazilian |
97 |
0.03% |
| Maltese |
93 |
0.03% |
| Serbian |
85 |
0.03% |
| Pennsylvania German |
68 |
0.02% |
| Armenian |
66 |
0.02% |
| Albanian |
57 |
0.02% |
| Israeli |
50 |
0.02% |
| Assyrian/Chaldean/Syriac |
46 |
0.01% |
| Australian |
22 |
0.01% |
| Iranian |
18 |
0.01% |
| Turkish |
13 |
0.00% |
| Icelander |
8 |
0.00% |
| Cajun |
7 |
0.00% |
| Guyanese |
5 |
0.00% |
| Estonian |
3 |
0.00% |